Simple example
To illustrate the basic usage, here is a very simple first example, that doesn’t use laziness. More advanced examples are in the menu above, and further examples in the GitHub repository.
Extensions and imports for this Literate Haskell file
HaskellScroll within code
{-# LANGUAGE CPP #-}
{-# LANGUAGE ExtendedDefaultRules #-}
module Index where
import LazyPPL
import LazyPPL.Distributions
import Data.ListHaskellScroll within code
import Graphics.Matplotlib hiding (density)Suppose we know that there are fewer buses on Sundays than on other days. I notice 4 buses in an hour, what is the probability it is a Sunday?
HaskellScroll within code
model :: Meas Bool
model = do
  -- Prior belief: it is Sunday with prob. 1/7
  sunday <- sample $ bernoulli (1/7)
  -- I know the rates of buses on the different days:
  let rate = if sunday then 3 else 10
  -- observe 4 buses
  score $ poissonPdf rate 4
  return sunday
We run a Metropolis-Hastings simulation to get a stream of draws from this unnormalized measure. We plot a histogram of the results, which shows the posterior probability that it is Sunday, given that we saw 4 buses.
HaskellScroll within code
inference :: IO ()
inference = do
  xws <- mh 1 model
  plotHistogram "images/index-posterior.svg" (map fst $ take 1000 xws)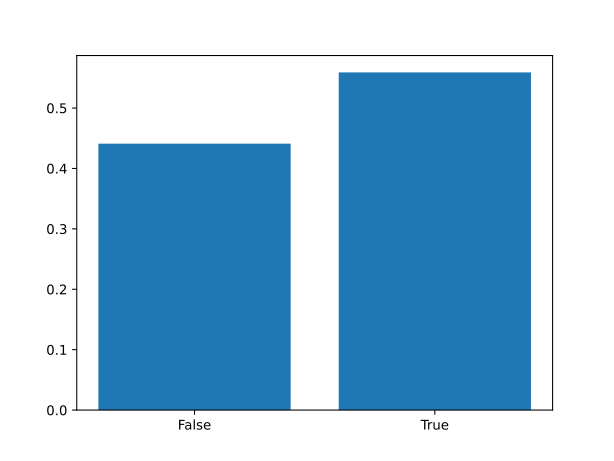
Plotting utilities
HaskellScroll within code
plotHistogram :: (Show a , Eq a) => String -> [a] -> IO ()
plotHistogram filename xs = do
  putStrLn $ "Generating " ++ filename ++ "..."
  let categories = nub xs
  let counts = map (\c -> length $ filter (==c) xs) categories
  file filename $ bar (map show categories) $ map (\n -> (fromIntegral n)/(fromIntegral $ length xs)) counts
  putStrLn $ "Done."

main = do {inference}