Relational inference with a CRP-based infinite relational model
This example, which follows an example from Church, demonstrates how the abstract types of the Chinese Restaurant Process can be used to program an infinite relational model.
Extensions and imports for this Literate Haskell file
{-# LANGUAGE CPP #-}
{-# LANGUAGE FlexibleInstances #-}
{-# LANGUAGE MultiParamTypeClasses #-}
{-# LANGUAGE ScopedTypeVariables #-}
{-# LANGUAGE ExtendedDefaultRules #-}

module IrmDemo where

import LazyPPL
import LazyPPL.Distributions
import LazyPPL.Distributions.DirichletP
import LazyPPL.Distributions.Memoization
import Data.Listimport Graphics.MatplotlibWe have six people, and we know that some of them talk to each other, and some of them don’t talk to each other. We want to infer the social groups. This is non-parametric in that we don’t assume a fixed number of social groups.
We set up a data type inhabited by the people of interest.
data Person = Tom | Fred | Jim | Mary | Sue | Ann deriving (Show , Eq, Ord, Enum, Bounded)
instance MonadMemo Prob Person
The model
The model is set up by building a Chinese Restaurant and placing the people at tables in it. Here we are using our Chinese Restaurant process interface (Distr.DirichletP). It involves abstract types Restaurant and Table, and provides two functions:
newRestaurant :: Double -> Prob Restaurant, which provides a new restaurant;newCustomer :: Restaurant -> Prob Table, which says which table a new customer will sit at.
The model describes an unnormalized probability measure on functions assigning tables to people.
model :: Meas (Person -> Table)
model = do
We first set up a new restaurant. Behind the scenes, this initiates lazy stick-breaking.
r :: Restaurant <- sample $ newRestaurant 1.0We define two memoized functions: the first, table, assigns a table to each person. Memoization is defined using laziness.
table :: (Person -> Table) <- sample $ memoize $ \person -> newCustomer rThe second memoized function, near, assigns to each pair of tables the chance that people on those tables will talk to each other.
near :: ((Table, Table) -> Double) <- sample $ memoize $ \(tableA, tableB) -> beta 0.5 0.5We define two helper functions, talks and nottalks, which we then map over the observations about various people talking or not talking to each other.
  let talks :: (Person, Person) -> Meas () = \(personA, personB) ->
                                            score $ near (table personA, table personB)
  let nottalks :: (Person, Person) -> Meas () = \(personA, personB) ->
                                              score $ 1 - near (table personA, table personB)
The data set:
  mapM_ talks [(Tom, Fred), (Tom, Jim), (Jim, Fred), (Mary, Sue), (Mary, Ann), (Ann, Sue)]
  mapM_ nottalks [(Mary, Fred), (Mary, Jim), (Sue, Fred), (Sue, Tom), (Ann, Jim), (Ann, Tom)]
Finally we return the assignment of tables to people.
return tableRunning the model
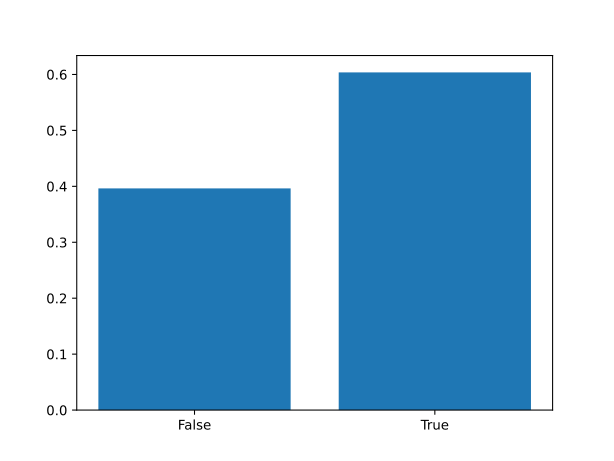
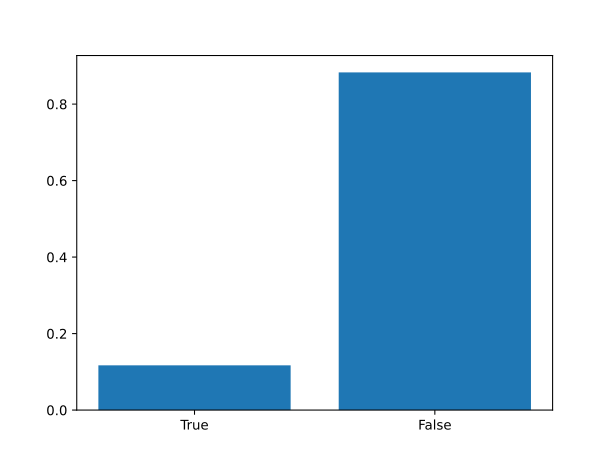
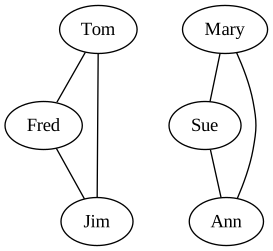
We sample from this unnormalized measure using a Metropolis-Hastings simulation. We calculate the probability of Tom/Fred and Tom/Mary sitting together, and also plot a graph of the sample with the highest likelihood.
main = do
  tws <- take 10000 <$> mh 0.2 model
  plotHistogram "images/irm-tom-fred.svg" $ map (\(t,_) -> t Tom == t Fred) $ tws
  plotHistogram "images/irm-tom-mary.svg" $ map (\(t,_) -> t Tom == t Mary) $ tws
  writeFile "images/irm-tables.dot" $ show $ maxap tws
Infinite relational model
Ready.
- 95% predictive interval
- log-likelihood low high
- Observations
Numerical results
Scroll within the table for more values.
Ready.
- log-likelihood low high
- Observations
Numerical results
Scroll within the table for more values.
Ready.
- log-likelihood low high
- Observations
Numerical results
Scroll within the table for more values.
Ready.
- Posterior programs (lines)
- Observations
Numerical results
Scroll within the table for more values.
Ready.
- log-likelihood low high
- Observations
Numerical results
Scroll within the table for more values.
Footnote
The example at Probmods actually gives different histograms to the ones here, but we suspect that this is an issue with the mh-query parameters in that example, because webchurch’s rejection sampling agrees with our histograms.
Plotting code
-- The sample with the highest weight, that is, the highest likelihood, from a list of weighted samples
maxap xws =
    let maxw = (maximum $ map snd xws) in
    let (Just x) = Data.List.lookup maxw $
                                    map (\(z, w) -> (w, z)) xws in
xtableToDot :: (Person -> Table) -> String
tableToDot f = "graph tables {" ++ concat [ show a ++ " -- " ++ show b ++ "; " | a <- people , b <- people , a < b, f a == f b] ++ "}"
where dotLine a b True = show a ++ " -- " ++ show b ++ "\n"
people = [minBound..maxBound]
instance Show (Person -> Table) where show f = tableToDot fplotHistogram :: (Show a , Eq a) => String -> [a] -> IO ()
plotHistogram filename xs = do
putStrLn $ "Generating " ++ filename ++ "..."
let categories = nub xs
let counts = map (\c -> length $ filter (==c) xs) categories
file filename $ bar (map show categories) $ map (\n -> (fromIntegral n)/(fromIntegral $ length xs)) counts
putStrLn $ "Done."