Clustering with a lazy Dirichlet process
This file contains an example of non-parametric clustering using a Dirichlet process. The idea of clustering is that we have some data points and we try to group them into clusters that make sense.
Extensions and imports for this Literate Haskell file
{-# LANGUAGE CPP #-}
{-# LANGUAGE ExtendedDefaultRules #-}
module ClusteringDemo where
import Control.Monad
import Data.List
import Data.Monoid
import LazyPPL
import LazyPPL.Distributions
import LazyPPL.Distributions.DirichletP
import LazyPPL.Distributions.Memoization
import LazyPPL.SingleSite
import Numeric.Log

-- In Ghci you will need to :set -fobject-codeimport Data.Colour.RGBSpace.HSV
import Data.Colour.SRGB
import Graphics.Matplotlib hiding (density)
import Helpers (maxWeightElement)dataset = [(7.7936387, 7.469271), (5.3105156, 7.891521), (5.4320135, 5.135559), (7.3844196, 7.478719), (6.7382938, 7.476735), (0.6663453, 4.460257), (3.2001898, 2.653919), (2.1231227, 3.758051), (3.3734472, 2.420528), (0.4699408, 1.835277)]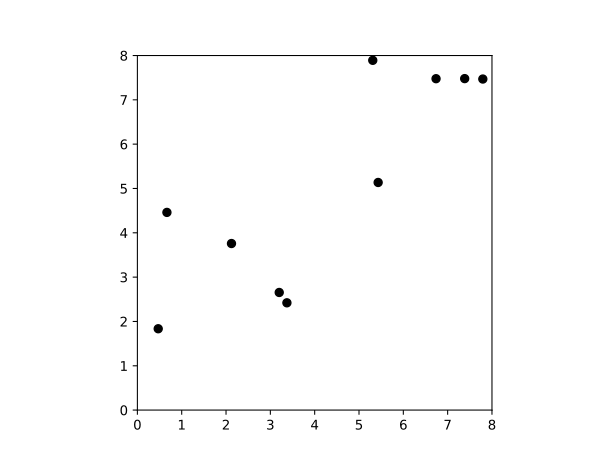
Code for plotting the data points.
plotDataset :: IO ()
plotDataset = do
  let filename = "images/clustering-dataset.svg"
  putStrLn $ "Generating " ++ filename ++ "..."
  file filename $ mplBivarNormal 0 0 100 0 (scatter [0,8] [0,8] @@ [o2 "color" "white"]) % scatter (map fst dataset) (map snd dataset) @@ [o2 "color" "black"]
  putStrLn $ "Done."
We first define a generic clustering model that uses a Chinese Restaurant process. The parameters for our generic clustering model are:
xs :: [a], a data set
pparam :: Prob b, from which we sample a parameter for each clusterlike :: b -> a -> Log Double, parameterized likelihood function, which we use to score the cluster assignment for each data point
cluster :: [a] -> Prob b -> (b -> a -> Log Double) -> Meas [(a, Double, b)]
cluster xs pparam like =
  do
    -- sample a distribution from a Dirichlet process
    rest <- sample $ newRestaurant 0.3
    -- lazily sample an infinite list of cluster parameters
    param <- sample $ memoize $ const pparam
    -- lazily sample an infinite list of colors
    color <- sample $ memoize $ const $ uniformbounded 0.2 1
    -- for each data point, sample a cluster and return
    --   the corresponding color and parameter
    forM xs
      ( \x -> do
          i <- sample $ newCustomer rest
          scoreLog $ like (param i) x
          return (x, color i, param i)
      )
Here we are using our Chinese Restaurant process interface (Distr.DirichletP). It involves abstract types Restaurant and Table, and provides two functions:
newRestaurant :: Double -> Prob Restaurant, which provides a new restaurant;newCustomer :: Restaurant -> Prob Table, which says which table a new customer will sit at.
We model data points by customers to a restaurant, and they are in the cluster if they sit at the same table. The restaurant is implemented in Distr.DirichletP by a lazy stick-breaking construction.
The tables support stochastic memoization via a function memoize :: (Table -> Prob a) -> Prob (Table -> a). This is defined using laziness (lazy tries). This memoization allows us to randomly assign parameters and colours to clusters/tables.
We try clustering on the synthetic data set dataset.
example :: Meas [((Double, Double), Double, (Double, Double, Double))]
example =
  cluster
    dataset
    (do x <- normal 5 4; y <- normal 5 4; prec <- gamma 2 4;
                                        return (x, y, 1 / sqrt prec))
(\(x, y, s) (x', y') -> Exp (normalLogPdf x s x' + normalLogPdf y s y'))infer =
do
xycws' <- mh1 example
let xycws = take 20000 xycws'
let xyc = maxWeightElement xycws
-- for illustration we plot the sample with the highest likelihood
plotCoords "images/clustering-map.svg" xycThis produces the following cluster asssignment:
Dirichlet-process clustering
Ready.
- 95% predictive interval
- log-likelihood low high
- Observations
Numerical results
Scroll within the table for more values.
Ready.
- log-likelihood low high
- Observations
Numerical results
Scroll within the table for more values.
Ready.
- log-likelihood low high
- Observations
Numerical results
Scroll within the table for more values.
Ready.
- Posterior programs (lines)
- Observations
Numerical results
Scroll within the table for more values.
Ready.
- log-likelihood low high
- Observations
Numerical results
Scroll within the table for more values.
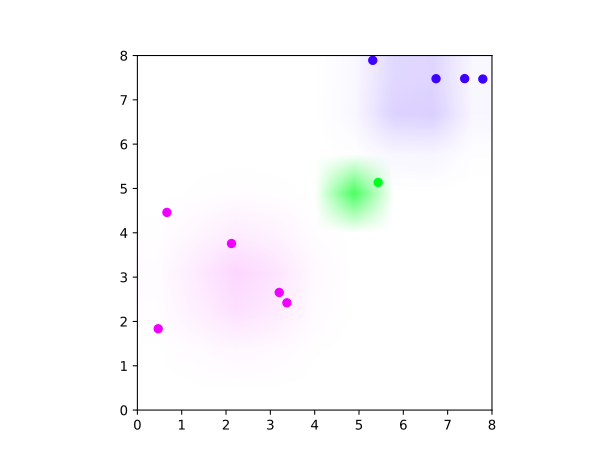
Code for plotting the data points and clusters.
plotCoords :: String -> [((Double, Double), Double, (Double, Double, Double))] -> IO ()
plotCoords filename dataset = do
  putStrLn $ "Generating " ++ filename ++ "..."
  let starterplot =
       scatter [0,8] [0,8] @@ [o2 "color" "white"]
  let gaussians = (foldl (\p (c,x,y,s) -> mplBivarNormal x y s c p) starterplot (nub $ map (\(_,c,(x,y,s))->(c,x,y,s)) dataset))
  let plot = foldl
             (\p -> \((x,y),c,_) -> let c' = hsv (c * 365) 1 1 in
                         p % scatter [x] [y] @@ [o2 "color" [channelRed c',channelGreen c',channelBlue c']])
             gaussians
             dataset
  file filename plot
  putStrLn $ "Done."

mplBivarNormal :: Double -> Double -> Double -> Double -> Matplotlib -> Matplotlib
mplBivarNormal mux muy sigma c p =
          p % imshow ws @@ [o2 "interpolation" "bilinear"
               ,o2 "origin" "lower"
               ,o2 "extent" [0::Double, 8, 0, 8]]
                 where delta = 0.025::Double
                       xs = [0.0+delta..8.0]
                       ys = [0.0+delta..8.0]
                       r = channelRed(hsv (c * 365) 1 1)
                       g = channelGreen(hsv (c * 365) 1 1)
                       b = channelBlue(hsv (c * 365) 1 1)
                       ws = [[[r,g,b,exp (normalLogPdf mux sigma x + normalLogPdf muy sigma y)] | x <- xs] | y <- ys]

main :: IO ()
main = do { plotDataset ; infer }